Lab 5: Importance Sampling#
For the class on Monday, January 29th
Tip
Looking for hints?
A. Aliens’ Estimate of Human Population#
See the question about aliens’ estimate of human population in the Discussion Preview of Reading 05.
Based on the discussion you had with your partner in class, write down how you think the aliens should choose the 1,000 locations to get a more accurate estimate.
(Indicate your partner’s name if applicable)
// Add your answers to A here
B. Double the Rewards!#
You are invited to a game where you flip a fair coin \(n_\text{flips} = 1,000\) times. Before the game starts, you are given 1 dollar as your base reward. Then, every time you get a “heads” in the game, the reward you have at that point doubles!
B1. Simple simulation#
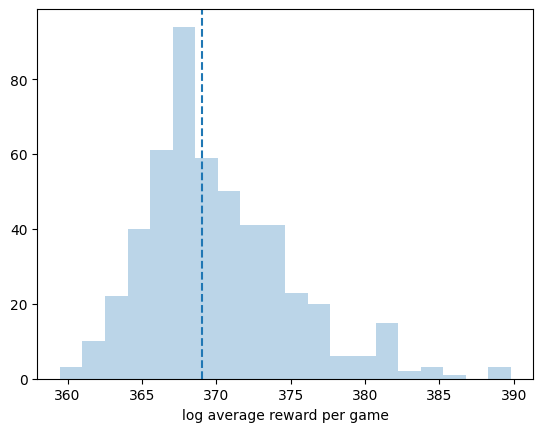
If you plainly simulate this game \(n_\text{games} =100\) times, and calculate the average reward from the \(n_\text{games}\) games, would you obtain an accurate estimate? Or, would you under- or over-estimate the expected reward?
Briefly explain your answer, and then verify your answer with the code below.
Tip
Because the reward from each game can be a very large number, to reduce numerical errors, we will store the logarithm instead. Let \(r_i = 2^{n_\text{heads}}\) denote the reward from the \(i\)th-game, and \(y_i = \log r_i\) the logarithm of the reward, which we will store. Then, the logarithm of the average of rewards from multiple games can be written as:
This can be done directly by scipy.special.logsumexp(y, b=1/n_games).
See scipy.special.logsumexp for detail.
// Add your answers to B1 here
# Common code needed for both B1 and B2

import numpy as np
from scipy.special import logsumexp
import matplotlib.pyplot as plt


def run_one_game(n_flips, p_heads):
    """
    Generates the result of a coin flip game with `n_flips`.
    Heads are represented by 1 in the returned array, tails by 0.
    The coin has a probability `p_heads` for showing heads.
    """
    return np.random.default_rng().choice([0,1], size=n_flips, p=[1.0-p_heads, p_heads])
# Implementation for B1 (You only need to edit the last line)

n_flips = 1000
n_games = 100
n_sims = 500

log_average_reward_each_sim = []
for _ in range(n_sims):

    log_reward_each_game = []
    for _ in range(n_games):
        game_result = run_one_game(n_flips, 1/2)
        n_heads = np.count_nonzero(game_result)
        log_reward = np.log(2) * n_heads
        log_reward_each_game.append(log_reward)

    log_average_reward = logsumexp(log_reward_each_game, b=1/n_games)
    log_average_reward_each_sim.append(log_average_reward)

plt.hist(log_average_reward_each_sim, 20, alpha=0.3);
plt.axvline(np.median(log_average_reward_each_sim), c="C0", ls="--");
plt.xlabel("log average reward per game");

## TODO: Uncomment the line below and replace ... with the theoretical expected value. Verify your answer in B1.
#plt.axvline(..., c="C3")

B2. Importance sampling with a biased coin#
We can get a better estimate by implementing importance sampling using a biased coin.
Consider a specific result from one game (i.e., a specific configuration of \(n_\text{flips}\) heads and tails), the likelihood of getting this particular configuration with a fair coin would differ from that with a biased coin. If the biased coin has a probability \(p_\text{biased}\) for getting heads, the likelihood ratio would be
In this case, the logarithm of the average of rewards should be written as
where \(y'_i\) are the logarithmic rewards sampled from games with a biased coin.
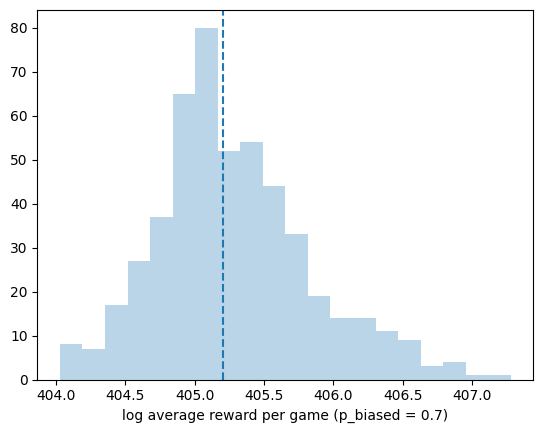
Rerun the simulation with \(p_\text{biased} = 0.7\) (see code below). Do you think the estimate will improve? Would you still under- or over-estimate the expected reward?
Make a guess and then verify your answer with the code below.
// Add your answers to B2 here
# Implementation for B2 (You only need to edit the last line)

def calc_log_likelihood_ratio(n_flips, n_heads, p_biased):
    """
    Calculates the log of likelihood ratio (w)
    """
    return np.log(0.5 / p_biased) * n_heads + np.log(0.5 / (1.0 - p_biased)) * (n_flips - n_heads)


n_flips = 1000
n_games = 100
n_sims = 500
p_biased = 0.7

log_average_reward_each_sim = []
for _ in range(n_sims):

    log_reward_each_game = []
    log_weight_each_game = []
    for _ in range(n_games):
        game_result = run_one_game(n_flips, p_biased)
        n_heads = np.count_nonzero(game_result)
        log_reward = np.log(2) * n_heads
        log_reward_each_game.append(log_reward)
        log_weight = calc_log_likelihood_ratio(n_flips, n_heads, p_biased)
        log_weight_each_game.append(log_weight)

    # Note that in the line below we add log reward and low weight from each game together for importance sample
    # Compare this line with the formula above!
    log_average_reward = logsumexp(np.add(log_reward_each_game, log_weight_each_game), b=1/n_games)
    log_average_reward_each_sim.append(log_average_reward)

plt.hist(log_average_reward_each_sim, 20, alpha=0.3);
plt.axvline(np.median(log_average_reward_each_sim), c="C0", ls="--");
plt.xlabel(f"log average reward per game (p_biased = {p_biased})");

## TODO: Uncomment the line below and replace ... with the theoretical expected value. Verify your answer in B2.
#plt.axvline(..., c="C3")

B3. Optimal choice of the proposed distribution#
Run B2 with different values of
p_biased(for example, 0.01, 0.02, …, 0.99). For each value ofp_biased, usenp.median(log_average_reward_each_sim)to represent the “typical” logarithmic average reward (averaged over \(n_\text{games}\) games) for that value ofp_biased. Reducen_simsto 10 to keep the runtime short.Plot the typical logarithmic average reward as a function of \(p_\text{biased}\).
What value of \(p_\text{biased}\) would give you an estimate that is the closest to the theoretical expected value? Can you explain why this value works the best?
// Add your answers to B3 here
# Implementation for B3 (check hint if you don't know where to start)
Final question#
Roughly how much time did you spend on this lab (not including the time you spent in class)?
// Write your answers here
Tip
How to submit this notebook on Canvas?
Once you complete this lab and have all your code, text answers, and all the desired results after running the notebook properly displayed in this notebook, please convert the notebook into HTML format by running the following:
jupyter nbconvert --to html /path/to/labs/05.ipynb
Then, upload the resulting HTML file to Canvas for the corresponding assignment.
